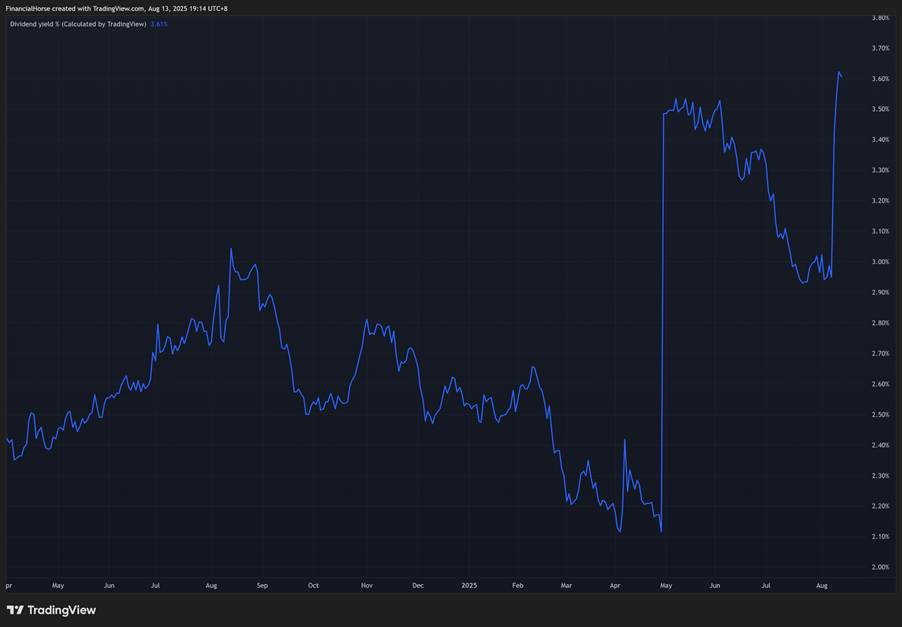
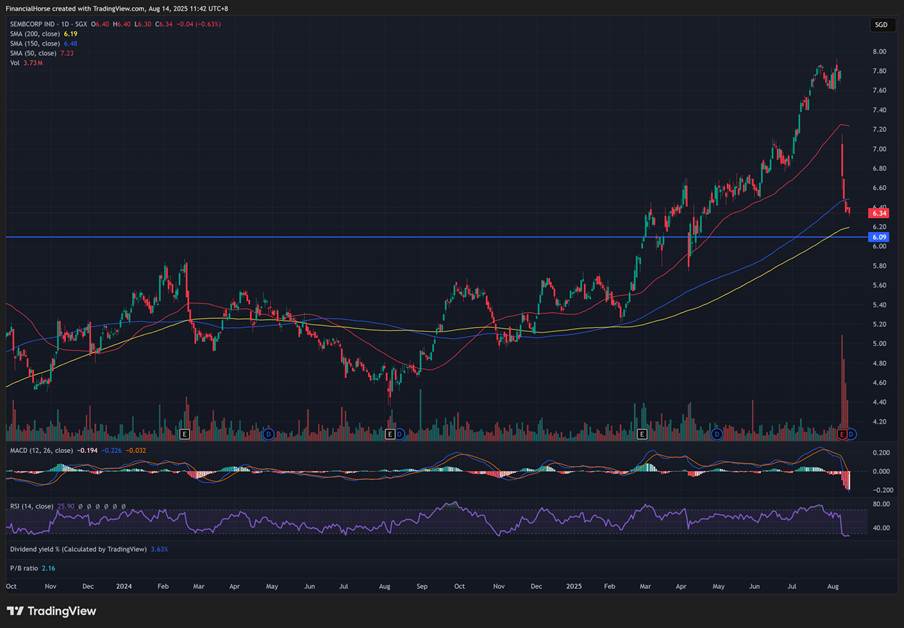
So I received this question from a FH Premium subscriber recently: Any thoughts on Sembcorp industry which plunged 20% in past few days? You can see the chart of Sembcorp Industries below for reference. You can see how after the recent earnings miss – the stock had a huge 20% drop in 4 trading days. […]
The post Sembcorp stock fell 20% in 4 days – Will I buy this stock at 4% dividend yield? appeared first on Financial Horse.
So I received this question from a FH Premium subscriber recently:
Any thoughts on Sembcorp industry which plunged 20% in past few days?
You can see the chart of Sembcorp Industries below for reference.
You can see how after the recent earnings miss – the stock had a huge 20% drop in 4 trading days.
That said, the stock is still up 15% year to date – so it’s doing decently well for investors who bought early on.

Whatever the case, I wanted to take a closer look at Sembcorp Industries, to see if it is worth buying this stock.
When I look at a new stock, I like to start by understanding how they make money.
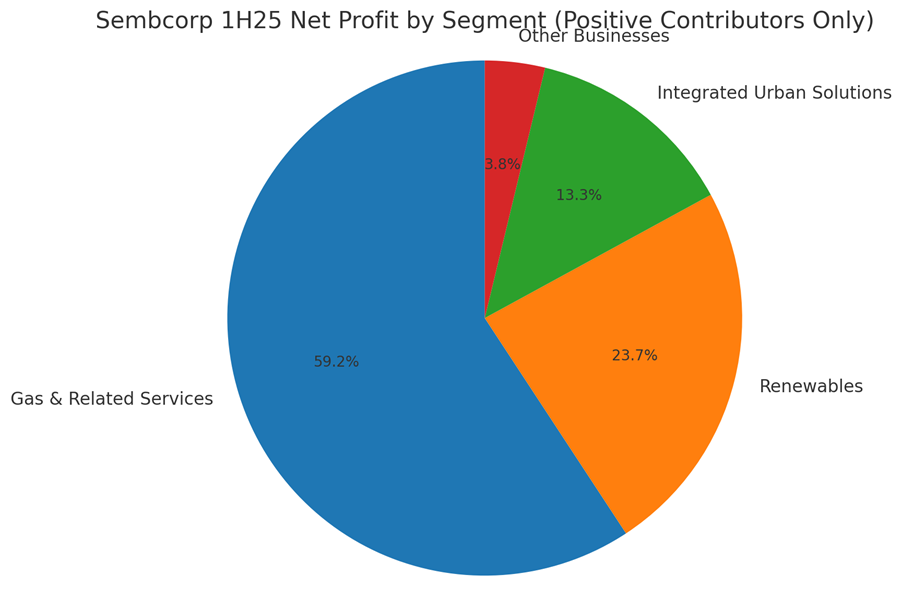
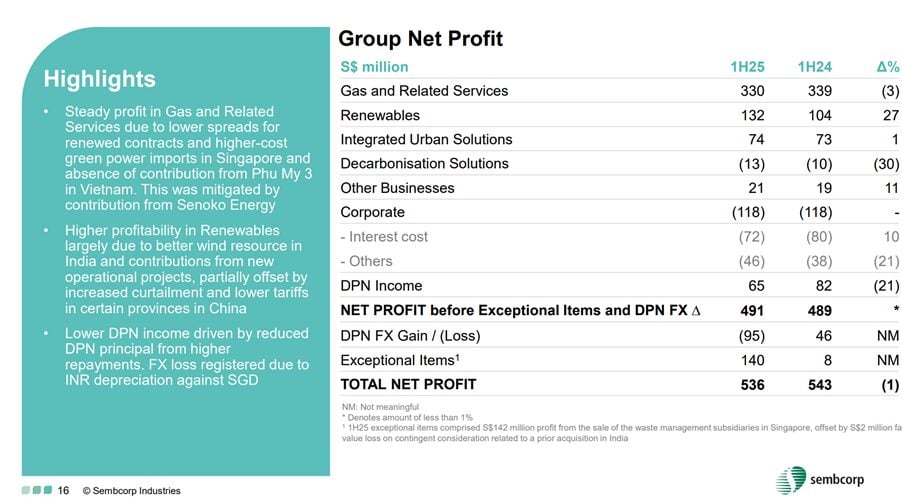
You can see the net profit breakdown below:

To make it easier to visualise, I plotted in pie chart form.
Long story short – Gas & related services is the big money maker, the core business.
While Renewables and Integrated Urban Solutions are the up and coming “growth” businesses.
To break it down:
Gas & Related Services (GRS) — S$330m (−3% y/y)
Core Singapore power and gas (generation, retail, imports).
Role: Cash engine.
Renewables — S$132m (+27% y/y)
Wind/solar/storage across India, China and SEA.
Role: Growth engine.
Integrated Urban Solutions (IUS) — S$74m (+1% y/y)
Water, waste and urban solutions. Stable contributor.
Role: Steady ballast.
Decarbonisation Solutions — −S$13m loss (vs −S$10m)
Early-stage decarbonisation offerings; still in investment/ramp-up phase.
Role: Option on future earnings.
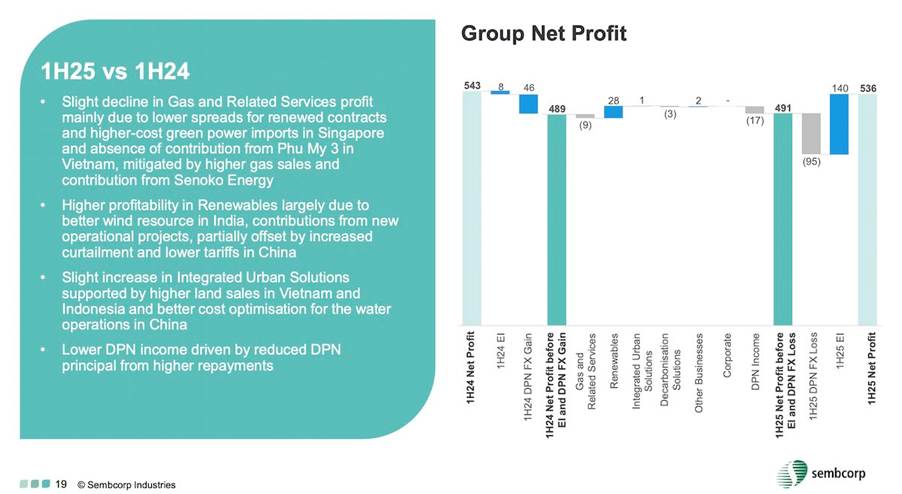
To put it simply, it came down to 2 reasons:
- Lower net profits
- Lower guidance from management on future earnings (in particular weaker renewables earnings due to China + Seasonality)
This was due to 3 main reasons:
- Weaker performance by Gas and Related Services
- Lower profit for China wind power business (and uncertainty going forward)
- Currency impact due to weakness in regional currencies against the Singapore dollar
Gas and Related Services reported net profit of S$330 million in 1H 2025, a decline of 3% from S$339 million in 1H 2024.
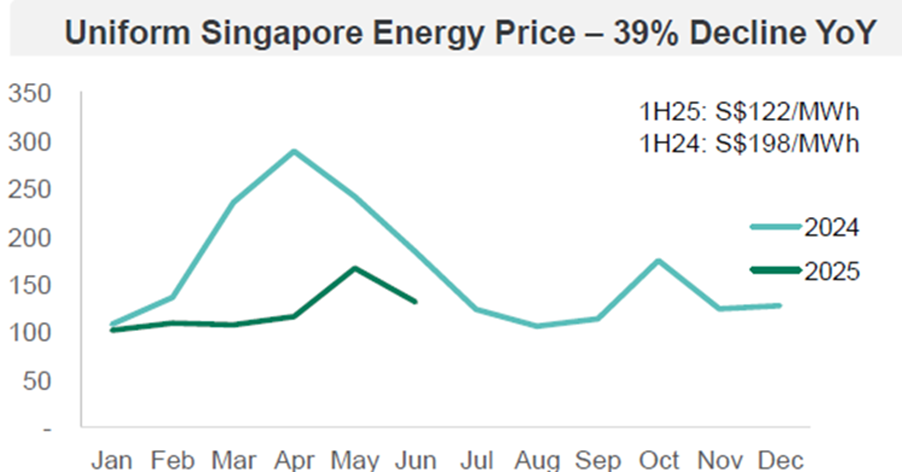
This was due largely to weaker performance for its power assets in Singapore with a 39% decline in wholesale electricity prices, as well as higher cost green power imports.
In other words – customers buy electricity at a cheaper price.
And Sembcorp bought electricity at a higher price.
That’s basically just a margin squeeze right there.
At the same time – Senoko Energy coming online offset the decline in earnings, resulting in only a 3% declining in profits despite the sharp drop in Singapore energy prices:
Just like how Singtel is taking its profits from its core business (Telco) and reinvesting in growth sectors (Date Centre and enterprise software).
I see Sembcorp the same way.
The core Singapore electricity generation business prints money.
And instead of just paying that profits out as dividend – they take the cash and reinvest in growth sectors.
Being renewables.
Renewables reported net profit of S$132 million in 1H 2025, an increase of 27% year on year.
The increase was also driven by additional 3.8GW of installed capacity compared to 1H24.
However, profit in this segment was impacted by weaker profit for its renewables business in China due to oversupply in the market.
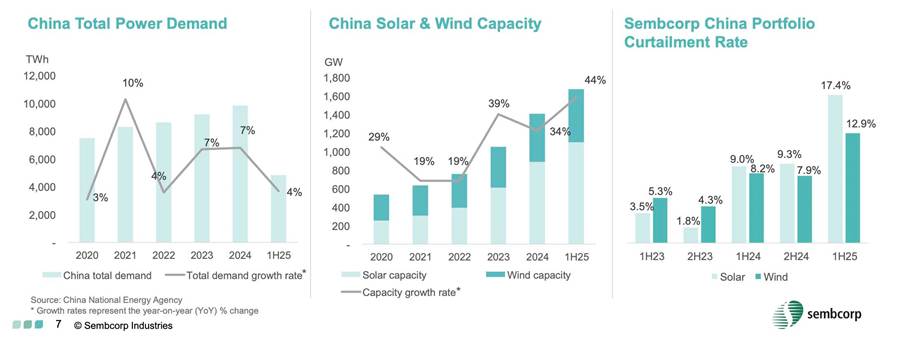
Because renewables is the “growth” segment.
We need to have a view on this.
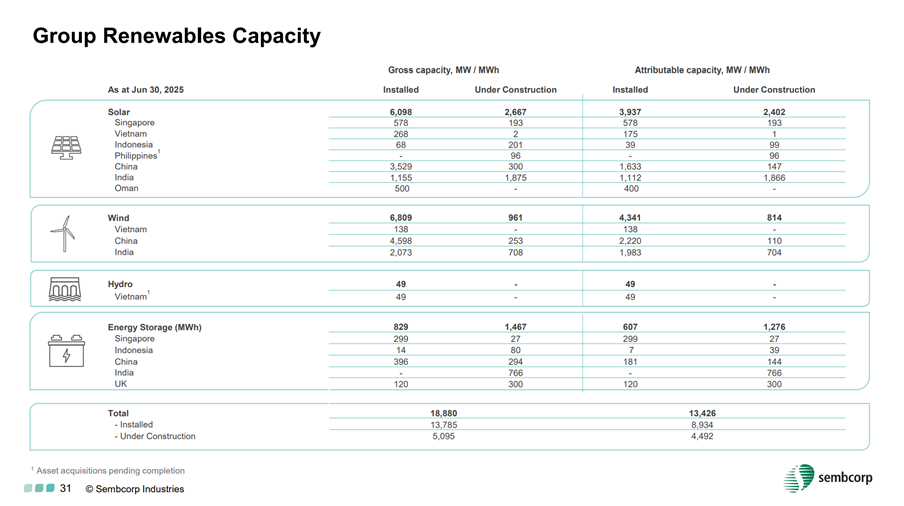
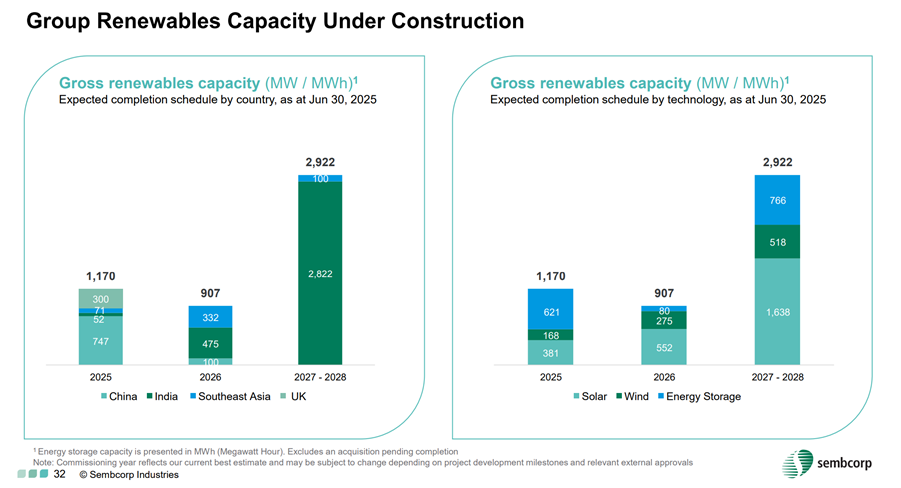
I’ve broken down the renewables capacity for Sembcorp below.
And you can see how the bulk of the capacity is located in China, followed by India.
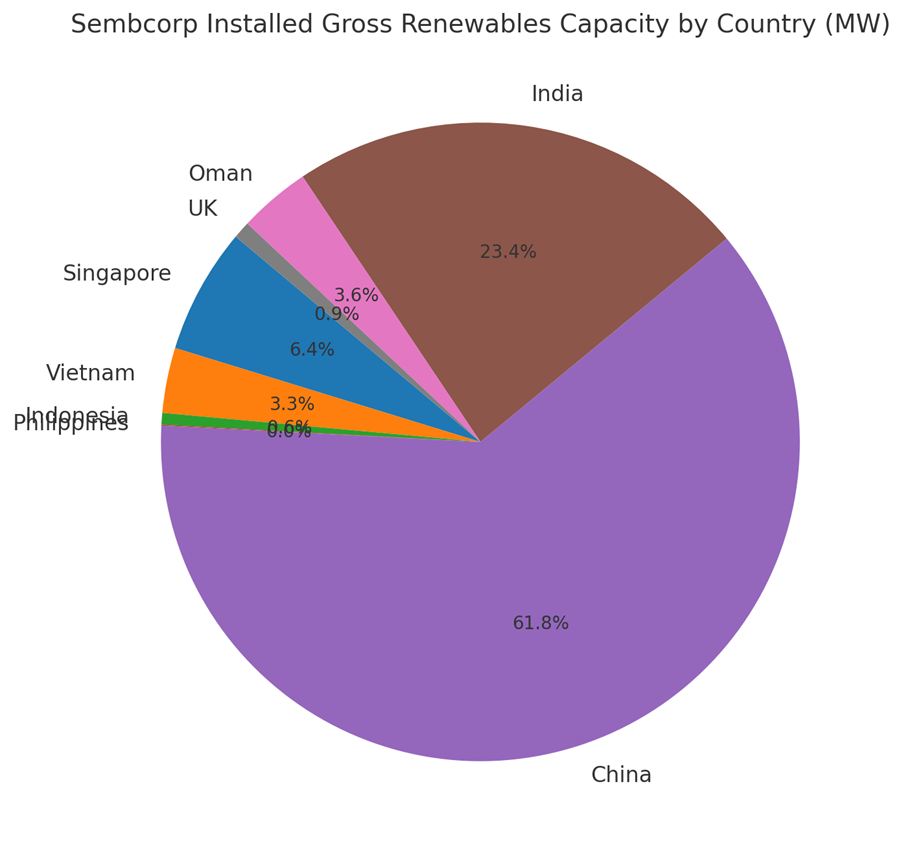
For what it’s worth, that huge exposure to China renewables makes me nervous.
Simply because this is China, and there is potential for a lot of overcapacity – especially given that cheap electricity is a national strategic priority for them.
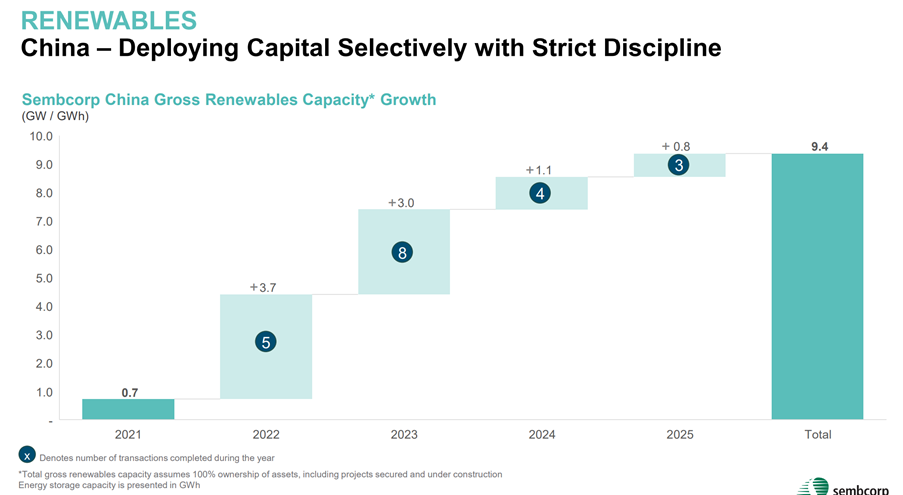
So yes I know that Sembcorp is “deploying capital selectively with strict discipline” in China.
But this is China, and frankly it doesn’t matter how disciplined you are if the other guy is building capacity like crazy.
Because at the end of the day, you’re all selling into the same market.
If there’s overcapacity, everybody suffers from lower prices.
The final reason for lower profits.
Is that the strengthening of the Singapore dollar against regional currencies led to an estimated impact of S$23 million on its earnings.
In particular, the strength of the Singapore dollar compared to the Chinese Yuan and Indian Rupee, where some of its assets are located, impacted its 1H 2025 earnings.
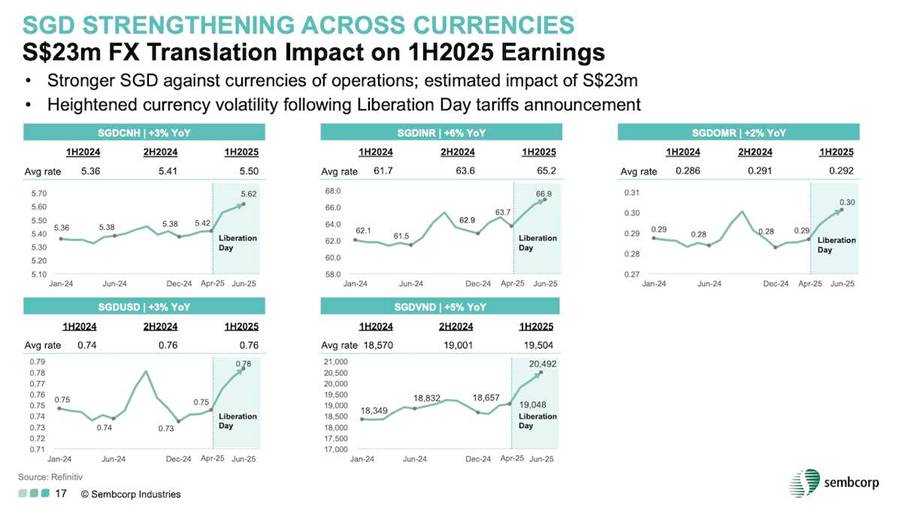
Can’t blame Sembcorp for this one.
FX goes both ways.
When SGD goes up you take an earnings hit.
When SGD goes down your earning look great.
I wouldn’t read too much into this one, and focus more on things you can actually control which is the core + growth business.
Post-correction, trailing yield is broadly in the ~3–4% zone, with a rough 40% payout ratio.
If the board decides to maintain a higher dividend, we could see a slightly higher forward yield (think ~3.5–5% range) as new assets come online.
How sustainable is the dividend yield?
Well the Operating cash flow from Singapore power + contracted renewables provides the base cash flow.
But this is power business, so capex is heavy by design (which sucks up cash flow).
But the pipeline is largely backed by long-tenor contracts, so cash conversion will improve over time as assets mature and come online.
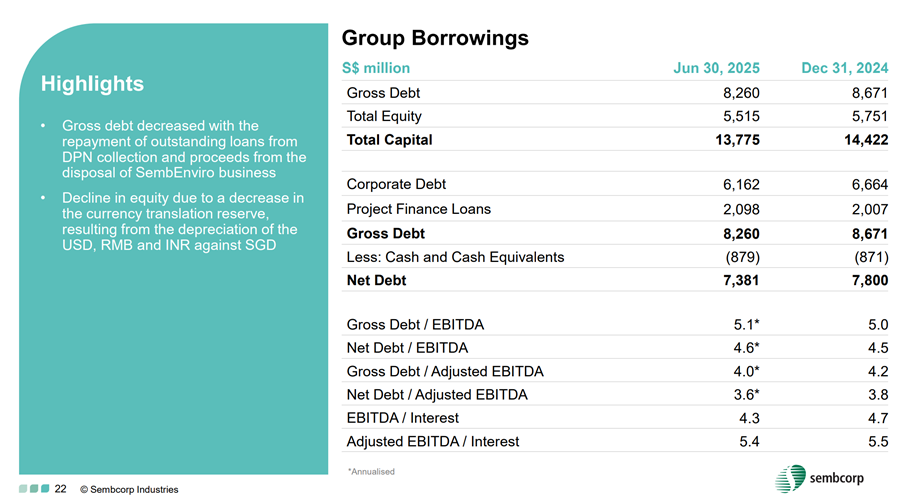
Balance sheet looks decent, and coupled with the staggered commissioning schedule give room to sustain (and gradually grow) dividend over time without starving growth.
I guess what I’m saying, is that the 3-4% dividend today is likely to be highly sustainable.
What would cap the dividend though – basically just comes down to strategic direction.
Management doesn’t want to pay a large dividend, because they want to reinvest in growth.
Hence the lowly 40% payout ratio.
So don’t expect something like DBS bank where management gets aggressive on capital return (80% payout ratio if you include special dividend), simply because management is equally focussed on growth.
Never miss a market beat—ride with Financial Horse wherever you go!
Get timely insights, sharp analyses, and real-time alerts by subscribing or following us on your favorite platform:
Crunching the valuations for Sembcorp Industries:
| Metric | Details |
| Market cap | S$11.3bn market cap |
| Valuation | P/E (TTM) ~11.3x Forward P/E ~10.4x P/B ~2.0x EV/EBITDA ~10x |
Personal take – post-selloff, Sembcorp screens reasonably valued for a growth-tilted utility pivoting hard into renewables.
The current mid-3% yield isn’t “high yield,” but it looks sustainable, with room to grow.
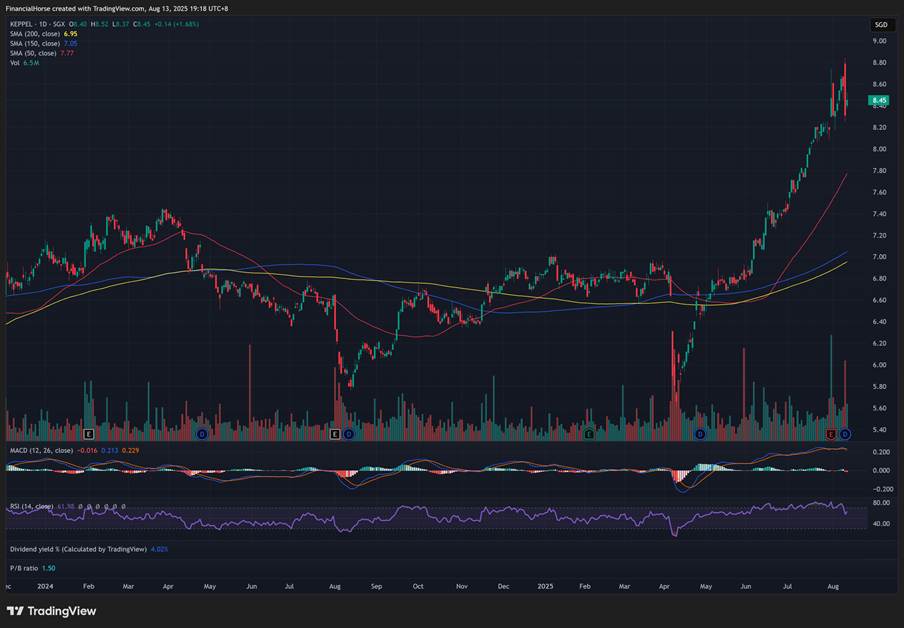
I guess at this point – I’m going to get the inevitable question of Sembcorp vs Keppel – which is the better buy.
Quick and dirty comparison below.
You can see how Keppel is bigger player, with a higher dividend yield, but also a higher PE.
That said, fundamentally their earnings make up is very different.
Sembcorp is almost a pure utility / electricity generation play.
Keppel has the whole data centre and fund management business as well.
| Dimension | Sembcorp | Keppel |
| Market cap | S$11.3–11.4 billion | S$15.3–15.6 billion |
| P/E (TTM) | ~11.3× | ~15.3× |
| Dividend profile | Mid‑3%, progressive as MWs switch on | ~4–5%, steadier, underpinned by fee / cash contracts |
| Core engine | Renewables build‑out + Singapore power spreads | Infra operations + asset management + development gains |
| Growth visibility | High (commissioning pipeline to 2028) | Solid (AUM growth, project pipeline, recycling) |
| Cyclicality | Medium: power spreads & China curtailment matter | Lower: more fee / contracted income mix |
| Balance sheet use | Capex‑heavy growth; recycling helps fund | Recycle/partner model; capital efficient |
| Key sensitivities | USEP (SG), China curtailment/tariffs, FX | Project delivery, AUM growth, exit valuations |
| Catalysts (12–18m) | Commissioning beats, SG spread stabilisation, dividend cadence | AUM wins, asset recycling, distribution / fee growth |
And for what it’s worth, Keppel stock has also been on a tear – without the Sembcorp sell-off (although you may argue this will come).
AI gave me a really good summary on this:
- Sembcorp: Growth-tilted energy/utility pivoting hard into renewables (wind/solar/storage) with Singapore power as the cash engine. After the ~20% drop, you’re buying a reset story: mid-cycle multiples, mid-3% yield, and higher execution torque.
- Keppel: Asset-light infrastructure & real-assets platform (development, operations, asset management). Earnings are more fee/contracting driven, less exposed to merchant power, with a typically higher dividend yield (think ~4–5%) and lower volatility.
Which is better today?
- If you want upside after a sell-off: Sembcorp. The thesis (renewables compounding) is intact; the 20% de-rating rebuilt a margin of safety. Base-case path is steady EPS with optional upside if China curtailment eases or SG spreads firm. Dividend looks sustainable and should edge up as cohorts ramp.
- If you want steadier income and lower drawdowns: Keppel. The fee/contracted mix and recycling model generally deliver a higher baseline yield with smoother earnings.
Verdict (12–18 months)
- Single-stock pick: Sembcorp edges it on risk-adjusted upside post-correction—provided you can stomach near-term chop.
- Barbell for most investors: 60% Sembcorp / 40% Keppel if you want growth tilt; flip to 40% / 60% if you prioritise income and stability.
- Execution checklist:
- For Sembcorp: watch monthly Singapore power spreads, China curtailment data, and commissioning cadence; dividend guidance at results.
- For Keppel: watch AUM growth, asset-recycling pace, fee trajectory, and distribution policy.
Bottom line: Into 2026, both can work. If forced to choose today, Sembcorp offers the cleaner re-rating setup; Keppel is your steadier yield anchor.
And you know what?
I think this answer was just spot on.
It really depends on what you want.
Sembcorp if you want exposure to power generation with decent valuations, with a low dividend yield today that should ramp up over time.
Keppel if you want power generation together with a broad infrastructure and fund management play with higher yield today.
I also got AI to run the scenario analysis numbers, and after some prompting I got it to a level that I liked:
Base Case (probability ~60%)
- Assumptions: Singapore spreads stabilise at lower but sustainable levels; China curtailment/tariffs remain a drag but ease marginally; commissioning continues on plan; funding costs gently ease; dividend held or edged up.
- Earnings/Multi: EPS flattish to modest growth; valuation mean-reverts toward mid-cycle.
- Price range outcome: +5% to +15% price, plus ~3–4% dividend = ~8% to ~19% total return.
- What would confirm it: Monthly power price stabilisation, steady commissioning updates, neutral-to-better China operating data.
Upside Case (probability ~25%)
- Assumptions: Faster China grid/storage fixes cut curtailment; new projects ramp cleanly; Singapore spreads firm; capital recycling and/or selective M&A accretion; clearer dividend step-up.
- Earnings/Multi: EPS beats conservative models; market re-rates the growth path.
- Price range outcome: +20% to +35% price, plus dividends = ~23% to ~39% total return.
- What would unlock it: A strong quarter from renewables (especially China/India), firmer local spreads, and a visible capital-return kicker.
Downside Case (probability ~15%)
- Assumptions: China curtailment worsens; Singapore spreads slip again; commissioning delays or cost overruns; FX stays unfriendly.
- Earnings/Multi: Cuts to consensus; multiple compresses further.
- Price range outcome: -10% to -25% price; dividend cushions but does not offset.
- What would trigger it: Two soft quarters in a row on renewables, plus fresh lows in local wholesale prices.
Yes, you can quibble about the probabilities, and the upside/downside in each scenario.
But I think big picture wise this is about it.
Base case is flat to up slightly.
Upside case is that you make quite decent profits.
And downside case you could see quite a hefty loss if renewables continue to stay soft and electricity prices fall further, but this is probably the lower probability event.
Coming back to the million dollar question – Will I buy Sembcorp stock?
For what it’s worth, I like the story of using profits from the Singapore power business to reinvest in renewables regionally.
I like that valuations are cheap.
I also like that dividend payout ratio is low, and the strong pipeline and decent balance sheet means we can probably see room for dividend growth years to come.
What makes me slightly more nervous is that huge exposure to China renewables, because it really just is very hard to predict how power prices in China play out (given national goals of keeping power costs low).
I think what holds me back – is that base case, the stock probably still just chops around for 12 months, and the upside is probably in the 10 – 20% range that I set out above.
And then if you’re unlucky (or lucky), you get the downside or upside scenario respectively.
That just doesn’t smack me as the kind of stock I need to go out and buy immediately.
So it’s a decent stock, and if share price comes down further I may just add a position.
But I think for now there are better opportunities elsewhere in the market.
And you can see the full list of stocks that I like on FH Premium, with regular updates on what I am buying and selling.
This post is written on 15 Aug and will not be updated going forward.
For my latest macro views, and what I am buying/selling, check out FH Premium.
You will also get access to my latest macro views, full stock / REIT watchlist, and personal portfolio (updated weekly).
So I received this question from a FH Premium subscriber recently: Any thoughts on Sembcorp industry which plunged 20% in past few days? You can see the chart of Sembcorp Industries below for reference. You can see how after the recent earnings miss – the stock had a huge 20% drop in 4 trading days.
The post Sembcorp stock fell 20% in 4 days – Will I buy this stock at 4% dividend yield? appeared first on Financial Horse.